
Your week's numbers,
before your first coffee.
Every KPI a venue operator opens the laptop for — sales, labour %, gross profit, weather, week close — sitting on one screen. Pick any week, drill any tile, no spreadsheet required.
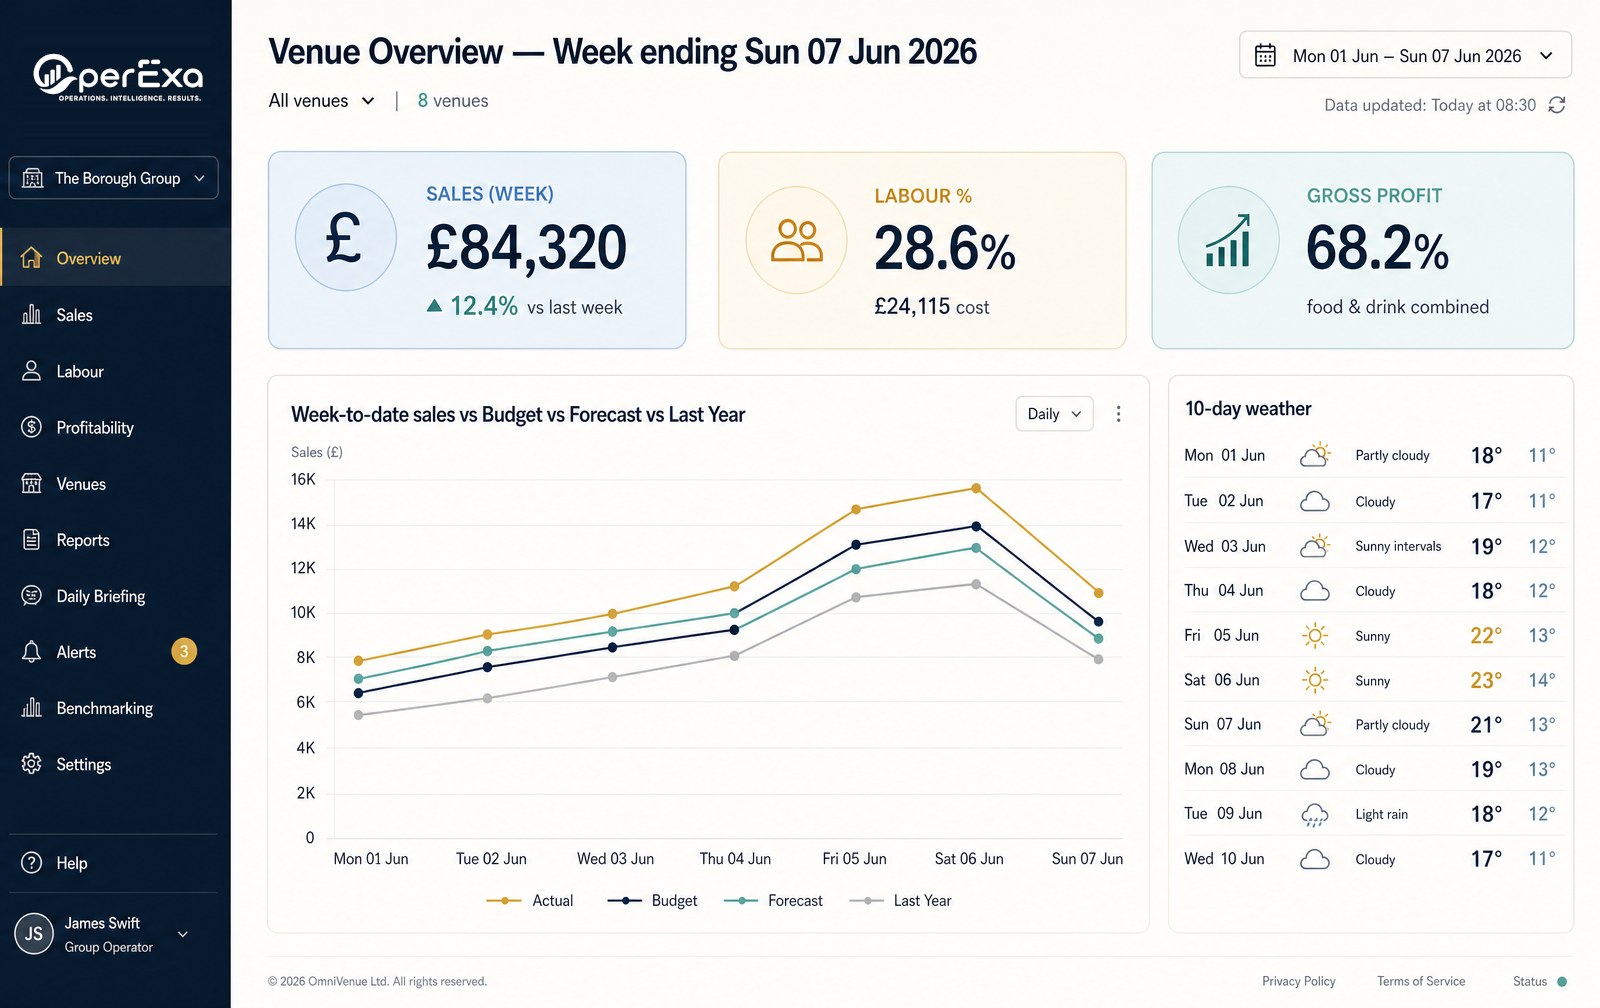
Yesterday's takings, week-to-date pace and this week's forecast — all closed and reconciled while your team is prepping.
Four comparatives on the same axis so a good week is obviously good and a bad week is impossible to hide.
10-day forecast per venue postcode next to your sales chart. Rain on a Saturday reads differently to rain on a Tuesday.
Revenue, banking, reconciliation, rota and stock — colour-coded by day, so nothing rolls into next week half-open.
Group Dashboard rolls up every venue with the same KPIs, ranked by variance, so you can jump straight to the one that needs a call.
Numbers update the moment a manager submits — no overnight batch, no accountant lag.
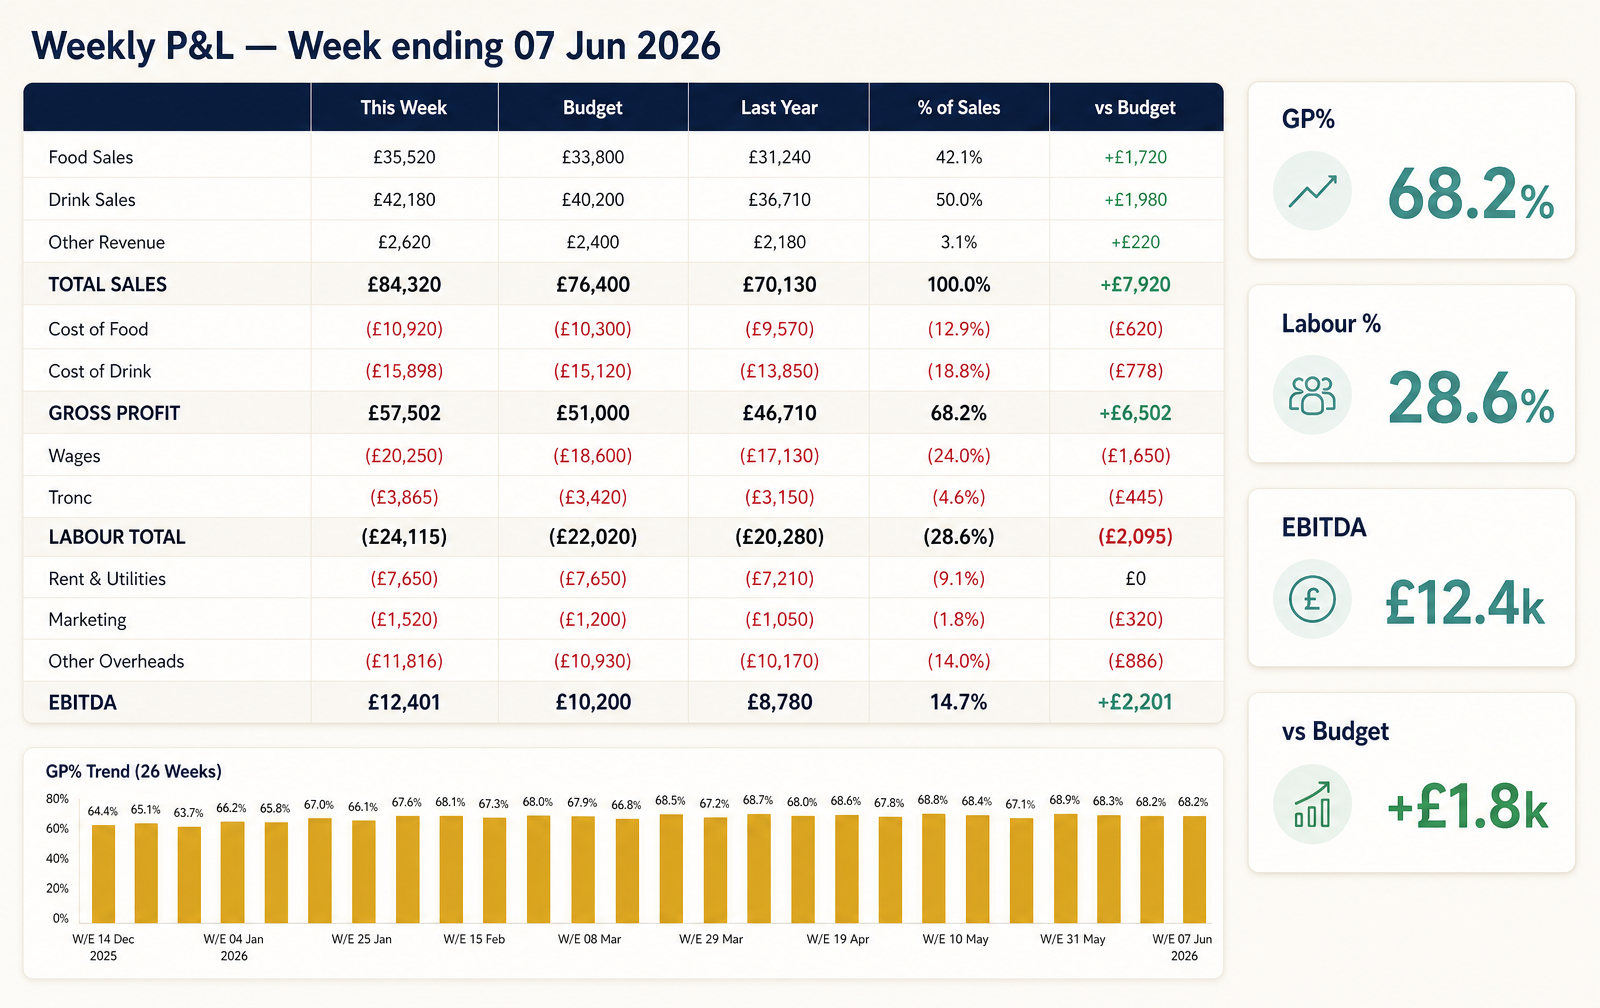
Drill from the dashboard straight into the full Weekly P&L.
Everything an operator needs, nothing they don't
- Sales, wages and stock KPIs with variance to Budget, Forecast and Last Year
- 10-day weather forecast per venue postcode
- Week close tracker for Revenue, Banking, Reconciliation, Payroll Rota and Stock
- Executive Summary and 26-week analysis available on Premium
- Group Dashboard for multi-site operators
See it running on your own numbers
Two-minute sign-up. The OperExa team activates modules for your tier and you can start capturing today's shift.